Blog: Who's Better - Radio Times or B3ta?
Last year, following my GIG ONE THOUSAND, I unleashed an AVALANCHE OF STATS from The Database Of ROCK, including sales figures, gigs played, people played WITH, and MUCH much more. Should you wish to revisit it you can start with the blog what EXPLAINS it all and then move forward from there. There are LOTS of graphs and tables as it goes along, so prepare yourself for EXCITEMENT!
I mention this because I have recently been looking over a couple of other graphs and tables, this time to do with The Funny Comics Fan Club. Our podcast provider gives us GRAPHS and LOGS of how many people have downloaded stuff, and I have been PORING over it regularly for the past few weeks - entirely for analytical reasons, of course, and not because I CRAVE VALIDATION. I mean, if I DID crave Validation you'd think it would show up somewhere in my ROCK career wouldn't you?
Anyway, it is GRATE, and gives us graphs like THIS:

This shows how many downloads we've had overall for the past 14 days. As you can see there are two PEAKS, which coincide almost exactly with us being featured in The Radio Times and then a few days later us getting a plug in the b3ta newsletter. It's not surprising that we DID have big bumps in downloads on those two occasions, but what DELIGHTS me is that the B3ta Bump is almost as big as The Radio Times one. I mean, one of these is a long-running periodicial very popular with the middle-aged demographic we're looking for - AND THE OTHER IS THE RADIO TIMES - so I suppose they WOULD be similar, but it still makes me happy that b3ta is reaching out to so many people still. WELL DONE EVERYBODY!
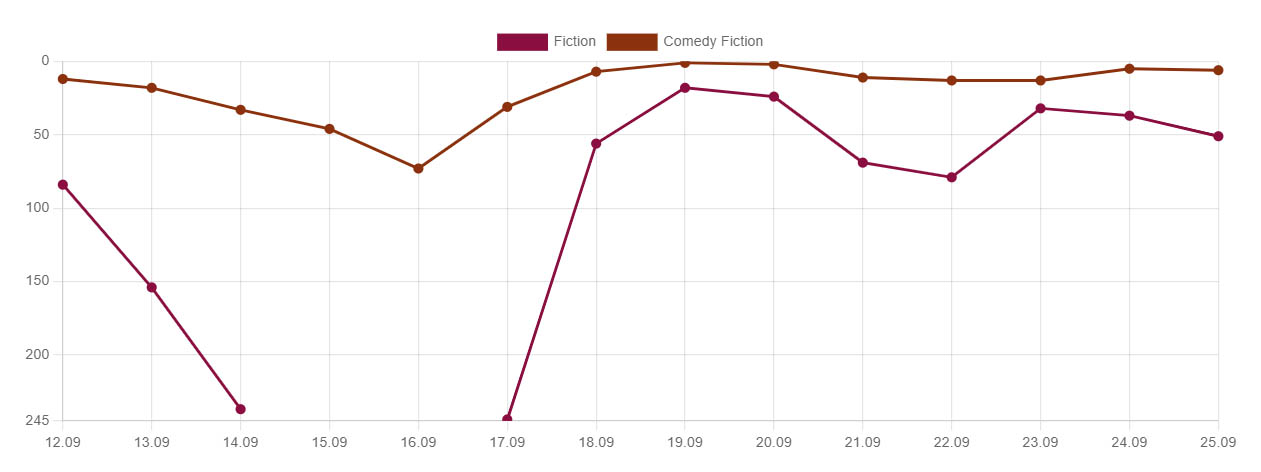
This graph is for downloads, but I remain unsure of whether or not it counts if someone STREAMS the show instead. Technically they don't actually download it then, so I don't know if that means it's stored with the provider (e.g. Spotify) or not, and it's not QUITE the same story when you look at the CHARTS. Here, for example, is a graph showing our CHART PLACINGS for the past 14 days.

Now, the MOST exciting part of this is that we got to NUMBER ONE in the Comedy Fiction chart last week (as previously discussed), but there's also something going on with this and the line for the Fiction chart (the lower one). The Fiction one shows a much closer relationship to the earlier downloads graph, with the same very similar bumps for the Radio Times and for B3ta. The upper line, showing our placing in the Comedy Fiction chart, doesn't move around anywhere NEAR as much, which leads me to think that there might possibly be quite a lot FEWER contenders in that one, so there is less competition for places. Maybe. Perhaps?
Either way, it remains JOLLY exciting for all of the above reasons, even if it remains Slightly Perplexing. I'm not 100% sure, for instance, who decided that we should be in those two charts and not 'Religion & Spirituality' or 'Fashion & Beauty', for example, both of which John and I are clearly Thought Leaders in. I also don't know what the relationship is between downloads and streams, or how many people are SUBSCRIBING to us as we go along on these different platforms, or all SORTS of things. I guess this is another of those occasions where, at some point, I'll have to learn more skills, but for now I'm just enjoying the FACT that we're IN these charts. It feels GOOD!
posted 26/9/2024 by MJ Hibbett


